Source: Designing Smarter Electrical Equipment Embedded with AI, Mathworks
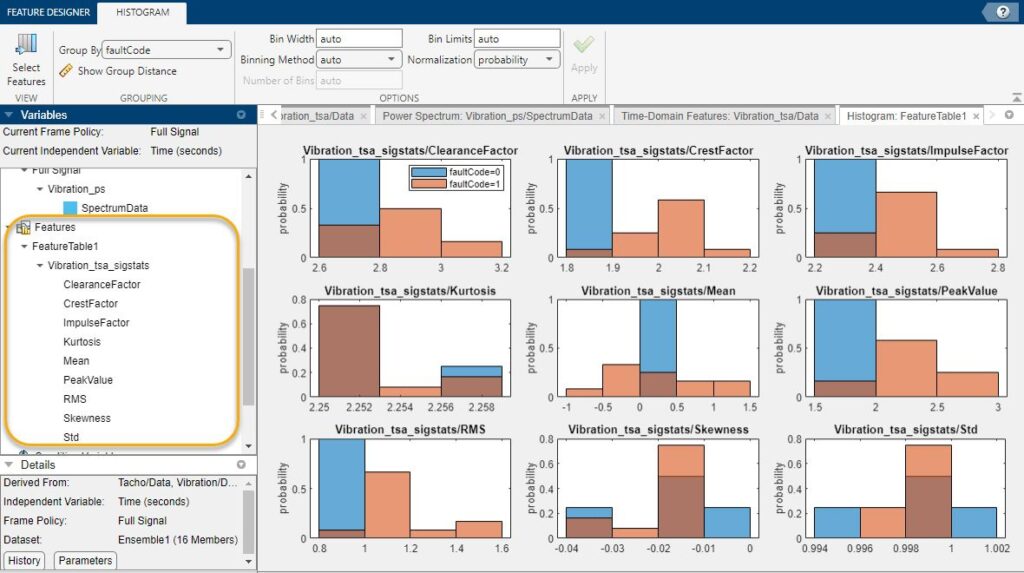
这张图片展示了一个用于分析振动数据的特征设计工具界面,带有显示从振动信号中提取的各种统计特征的直方图。以下是该图像的详细技术分析:
界面概览
- 特征设计工具: 这可能是一个用于信号处理和机器学习的软件套件的一部分,旨在从时间序列数据中提取特征。(正确,是Matlab)
- 分组和分箱控制: 在顶部,有按
faultCode分组、设置箱宽、箱限制和归一化方法的选项。这表明可以灵活地自定义数据的分组和可视化方式。
变量窗格
- 当前帧策略: 全信号
- 当前自变量: 时间(秒)
- 特征选择: 左侧窗格显示了从振动数据中提取的特征的层次列表。这些特征列在
FeatureTable1 > Vibration_tsa_sigstats下。
特征
列出的特征包括:
- 清除因子(Clearance Factor)
- 峰度因子(Crest Factor)
- 冲击因子(Impulse Factor)
- 峰度(Kurtosis)
- 均值(Mean)
- 峰值(Peak Value)
- 均方根(RMS)
- 偏度(Skewness)
- 标准差(Std)
详情窗格
- 派生自: Tacho/Data, Vibration/Data
- 自变量: 时间(秒)
- 帧策略: 全信号
- 数据集: Ensemble1(16个成员)
直方图分析
每个直方图代表特定特征的分布,按 faultCode(0 或 1)分开,表示是否存在故障。
- 清除因子:
- 概率分布显示,故障代码1(橙色)的值集中在约3.0,而故障代码0(蓝色)集中在约2.8。
- 峰度因子:
- 故障代码1(橙色)分布在约2.0处,而故障代码0(蓝色)略低一些。
- 冲击因子:
- 类似于峰度因子,故障代码1在约2.6处达到峰值,而故障代码0在约2.4处达到峰值。
- 峰度:
- 明显的区别在于,故障代码1(橙色)在较高值处显著达到峰值,而故障代码0则没有。
- 均值:
- 故障代码1的均值更分散,且略高于故障代码0。
- 峰值:
- 故障代码1显示出较高的峰值分布,相对于故障代码0。
- 均方根:
- 故障代码1的均方根值高于故障代码0。
- 偏度:
- 偏度的分布对于故障代码1更宽,表明在存在故障时偏度变化更大。
- 标准差:
- 故障代码1的标准差略高于故障代码0,表明在出现故障时数据变异性更大。
结论
这些直方图提供了一个清晰的可视化表示,显示了振动信号的不同统计特征如何基于故障(faultCode 1)或无故障(faultCode 0)的存在而变化。这些特征在预测性维护和机械系统故障诊断中至关重要,其中某些特征(如峰度、均方根和峰值)的较高值可能表明故障的存在。该界面允许详细分析和自定义,使其成为故障检测和状态监测中信号处理和机器学习应用的强大工具。
The image depicts a feature designer tool interface used for analyzing vibration data, with histograms showing various statistical features extracted from the vibration signal. Here’s a detailed technical analysis of the image:
Interface Overview
- Feature Designer Tool: This is likely a part of a software suite for signal processing and machine learning, aimed at feature extraction from time-series data. ——>Yes, it’s Matlab
- Grouping and Binning Controls: At the top, there are options for grouping by
faultCode, setting bin width, bin limits, and normalization method. This indicates the flexibility to customize how data is grouped and visualized.
Variables Pane
- Current Frame Policy: Full Signal
- Current Independent Variable: Time (seconds)
- Feature Selection: The left pane shows a hierarchical list of features extracted from the vibration data. The features are listed under
FeatureTable1 > Vibration_tsa_sigstats.
Features
The listed features are:
- Clearance Factor
- Crest Factor
- Impulse Factor
- Kurtosis
- Mean
- Peak Value
- RMS (Root Mean Square)
- Skewness
- Std (Standard Deviation)
Details Pane
- Derived From: Tacho/Data, Vibration/Data
- Independent Variable: Time (seconds)
- Frame Policy: Full Signal
- Dataset: Ensemble1 (16 Members)
Histograms Analysis
Each histogram represents the distribution of a specific feature, separated by faultCode (0 or 1), indicating whether a fault is present or not.
- Clearance Factor:
- Probability distribution shows that the faultCode 1 (orange) has higher values concentrated around 3.0, whereas faultCode 0 (blue) is around 2.8.
- Crest Factor:
- The distribution for faultCode 1 (orange) peaks around 2.0, whereas faultCode 0 (blue) peaks slightly lower.
- Impulse Factor:
- Similar to the Crest Factor, with faultCode 1 peaking around 2.6 and faultCode 0 peaking around 2.4.
- Kurtosis:
- A notable difference where faultCode 1 (orange) peaks significantly at a higher value compared to faultCode 0.
- Mean:
- Mean values for faultCode 1 are more spread out and slightly higher than for faultCode 0.
- Peak Value:
- FaultCode 1 shows a higher peak value distribution compared to faultCode 0.
- RMS:
- RMS values for faultCode 1 are higher than those for faultCode 0.
- Skewness:
- Distribution is wider for faultCode 1, indicating more variation in skewness when a fault is present.
- Std (Standard Deviation):
- FaultCode 1 has a slightly higher standard deviation compared to faultCode 0, suggesting more variability in the data when a fault occurs.
Conclusion
The histograms provide a clear visual representation of how different statistical features of the vibration signal differ based on the presence (faultCode 1) or absence (faultCode 0) of a fault. These features can be critical in predictive maintenance and fault diagnosis of mechanical systems, where higher values of certain features (like kurtosis, RMS, and peak value) can indicate the presence of faults. The interface allows for detailed analysis and customization, making it a powerful tool for signal processing and machine learning applications in fault detection and condition monitoring.
TSA: Time Synchronous Averaging